/LiveSwitch.io%20(v2)%20-%20Solutions/LiveSwitch.io%20(v2)%20-%20By%20Industry/LiveSwitch.io%20(v2)%20-%20iGaming/ls-industry-igaming.svg)
/LiveSwitch.io%20(v2)%20-%20Solutions/LiveSwitch.io%20(v2)%20-%20By%20Use%20Case/LiveSwitch.io%20(v2)%20-%20Financial/ls-use-cases-financial-services-icon1.svg)
/LiveSwitch.io%20(v2)%20-%20Solutions/LiveSwitch.io%20(v2)%20-%20By%20Industry/LiveSwitch.io%20(v2)%20-%20Industry%20Section%20Page/ls-industry-virtual-classrooms.svg)


/LiveSwitch.io%20(v2)%20-%20Global%20Elements/Resources%20Icons/ls-resources-datasheets-iconm.svg)
/LiveSwitch.io%20(v2)%20-%20Global%20Elements/Developer%20Icons/ls-developers-get-started.svg)
/LiveSwitch.io%20(v2)%20-%20Global%20Elements/Developer%20Icons/ls-developers-cloud-guides.svg)
/LiveSwitch.io%20(v2)%20-%20Global%20Elements/Developer%20Icons/ls-developers-rest-api-references.svg)
/LiveSwitch.io%20(v2)%20-%20Global%20Elements/Developer%20Icons/ls-developer-support-faq.svg)
/LiveSwitch.io%20(v2)%20-%20Global%20Elements/Developer%20Icons/ls-developers-release-notes.svg)
/LiveSwitch.io%20(v2)%20-%20Global%20Elements/Developer%20Icons/ls-developers-cloud-console-login.svg)
/LiveSwitch.io%20(v2)%20-%20Global%20Elements/Developer%20Icons/ls-developers-install-using-docker.svg)
/LiveSwitch.io%20(v2)%20-%20Developer%20Center/ls-developer-center-cta-card.svg)
Introducing LiveSwitch Cloud - Dive Deep into Live Video & Analytics
The team at Frozen Mountain is proud to formally announce LiveSwitch Cloud - enabling WebRTC developers and their teams to build and manage live video streaming and conferencing apps more easily than ever before. LiveSwitch Cloud provides the same powerful hybrid media server capabilities as its on-premise cousin LiveSwitch Server, however, it adds a feature-packed configuration console and dashboard and is fully managed 24/7/365 in the cloud.
The LiveSwitch Cloud console was designed to provide maximum application configurability and real-time call analytics all from one central dashboard. The built-in telemetry allows both managers and developers alike to visualize and understand the performance of their applications in real-time and empower them to make informed business decisions when they matter most.
In this blog article, we will highlight the top 3 insights you can gain from the LiveSwitch Cloud console dashboard. Stay tuned for part 2 where we will discuss how you can use LiveSwitch Cloud to create and manage your applications.
Connection Stats
The real-time connection stats displayed on the dashboard were designed to give you a quick visualization of overall client activity using your application. More specifically it shows:
- Client Counts: The total number of client devices currently connected to your application from any call source.
- Connection Counts: The total number of video connections being sent to the server from all connected clients.
- Channels: The total number of active channels currently used by all clients. Since channels can be used to segment and control every client and their connection properties, this can be a good representation of current operational complexity.
- Bandwidth Usage: The amount of bandwidth your application is using across all connected clients and servers.
- Connections per Hour: The peak connection counts each hour.
- Connections per Day: The total number of clients connected to your application each day.
This data enables you to instantly see your application’s usage patterns and can help you make decisions on what changes need to be made to improve performance or participant experience. It also will allow you to see in real-time how those changes have affected your connections and troubleshoot any problems that may arise during your application development and operations. For some, it’s the perfect dashboard to display in your lunch room or around the office to motivate the team.
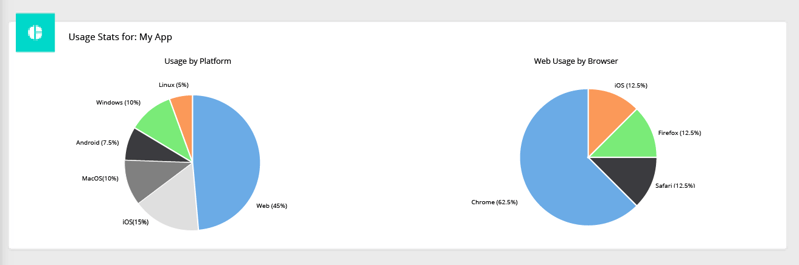
Usage Stats
The LiveSwitch Cloud console enables you to learn more about your customer’s behaviour by easily providing visualization of the historical platform and browser types reported by your user’s devices. As a result, you can focus your team’s development, support, and documentation efforts on the platforms and devices that your audience is most likely to join on.
Remember: LiveSwitch Cloud supports the widest range of platforms, devices, languages and frameworks so that you can easily extend your application to different devices, browsers and markets at any time in the future.
Geo-Location
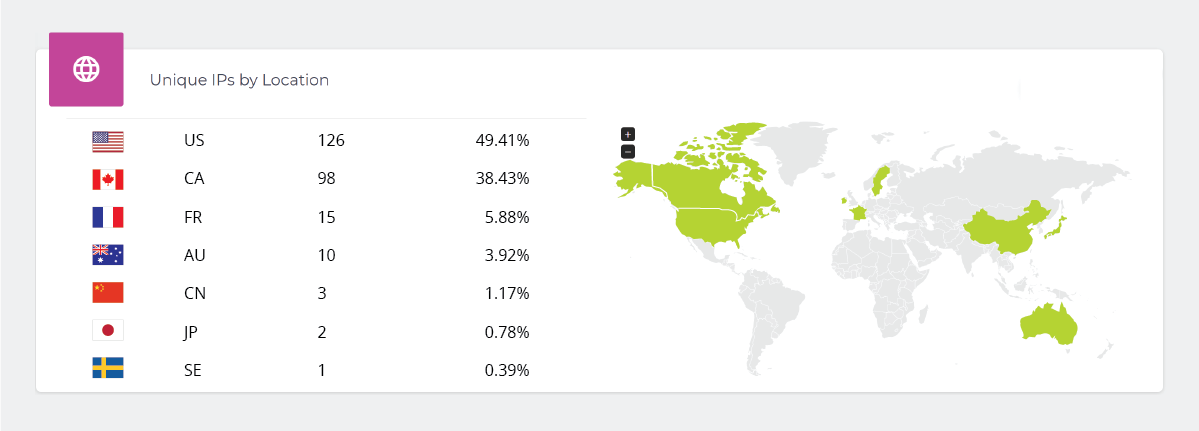
The geo-location data produced in the console allows you to learn where your customers are connecting from each day so that you can target them with localized insights. The data is broken down by country and client counts so that you can better understand your markets and tactically choose when and where to expand. This information will not only help you with asset planning and resource management, but it will also allow you to create custom marketing pushes in the regions where you have the most traction.
Conclusion
LiveSwitch Cloud’s powerful analytics and telemetry will help you to visualize how your application is performing in real-time so that you can make decisions when they matter most. Whether you are looking for information on usage statistics or connection quality, LiveSwitch Cloud’s user-friendly dashboard makes it possible.
Stay tuned for part 2, where we will dive deep into managing your applications and channels from the console. Better yet? Subscribe to our blog and never miss out on exciting updates and new features.